| |
||||||||||||||||||
| Home » Demos » Bankruptcy Prediction Demo | ||||||||||||||||||
 |
||||||||||||||||||
|
Bankruptcy Prediction Demo
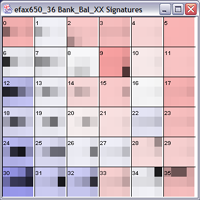
As part of a larger datamining study (described here and here) we transformed about 1 million Credit Bureau records of households with marginal credit scores (650 to 680) by filtering out many of the 200+ items per record and by expanding each household's revolving credit balance into 12 categories, based on the account's age and credit limit. A data mining program then divided these households into 36 groups using these new categories. Clicking this Demo link brings up a separate display* of these groups in a rectangular grid, as shown below;
On the left, the color of each rectangle reflects the average credit rating of each group, pink being lower and blue being higher. The top 3 credit categories of each group are also shown. Not much of a pattern is visible when the rectangles are colored by their credit score. But click the "Color By" menu in the demo and select "Bankruptcies" and you'll get the coloration shown on the right above. Now the color of each rectangle indicates the fraction of households in that group that went bankrupt in the following year, and a pattern does appear, showing that the datamining program clustered the higher bankruptcy risks into the lower right corner of the grid. In group 30, for example, the bankruptcy rate is 3.8%, which is 13 times higher than average. Note that many of the other groups in this marginal-credit pool in fact have lower-than-average bankruptcy rates.
Customers and lenders both benefit when a finer filter like this is used to separate the credit-worthy from those who pose a higher risk.
*If the Demo button fails, try disabling "Ad Blocking" in
your firewall, i.e. Norton Internet Security; also, you
can see what you missed
here |
|||||||||||||||||
| Michael Rothman & Associates LLC, mjrothman@preference-engine.com, (845) 223-3900 | ||||||||||||||||||
 Data Mining Demos