The
Rothman
Index
 The Problem
Too MUCH medical information...
The Solution
A single-number health condition Index based on 26 inputs from the EMR
Validation
How well does the Rothman Index reflect patient condition?
|
The Problem
Discerning a slow decline in a patient's condition is difficult with even a careful review of the medical record, especially if the physician or nurse has not seen the patient before. It is not that there is not enough data, but rather,
too much and too hard to decipher.
To a large extent, electronic medical records (EMR) are used simply as electronic filing cabinets. Little benefit in terms of either reducing cost or increasing quality has been observed so far.
Our work leverages this digital resource. We extract, integrate, summarize and visualize.
The Rothman Index
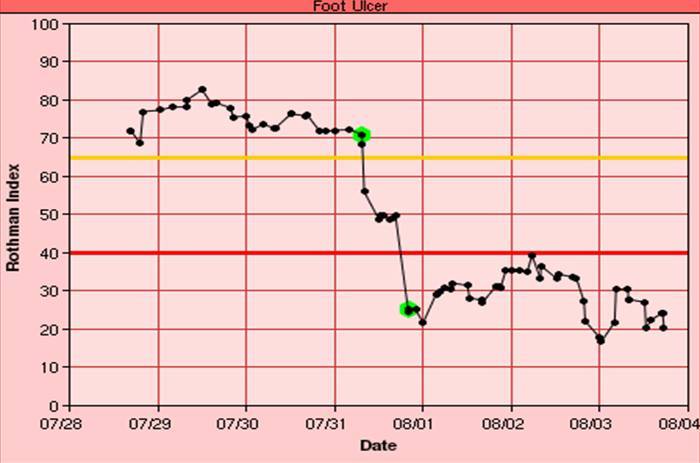 We have created a new single-number index based on a patient's vital signs, lab results, and nursing assessments. This index, named the Rothman Index in honor of the late Florence A. Rothman, is a measure of a patient's condition, and is particularly useful for showing changes in that condition. It is set on a scale of 0 to 100, with 100 being unimpaired,
and is meant to capture the immediate circumstance.
When plotted vs. time, the Rothman Index provides a picture that helps physicians and nurses determine if their patient is getting better or getting worse. Also, by reducing the patient's general condition to a single number, we facilitate communications between healthcare providers and between institutions.
The Rothman Index is computed from 26 vital signs, nursing assessments, and lab results commonly found in EMR systems, and so no extra work is required from doctors or nurses.
We have created a new single-number index based on a patient's vital signs, lab results, and nursing assessments. This index, named the Rothman Index in honor of the late Florence A. Rothman, is a measure of a patient's condition, and is particularly useful for showing changes in that condition. It is set on a scale of 0 to 100, with 100 being unimpaired,
and is meant to capture the immediate circumstance.
When plotted vs. time, the Rothman Index provides a picture that helps physicians and nurses determine if their patient is getting better or getting worse. Also, by reducing the patient's general condition to a single number, we facilitate communications between healthcare providers and between institutions.
The Rothman Index is computed from 26 vital signs, nursing assessments, and lab results commonly found in EMR systems, and so no extra work is required from doctors or nurses.
Validation
Comparison with Historical Data
 We have done extensive statistical analyses of data from several hospitals to show that the Rothman Index does correlate with other measures of a patient's condition.
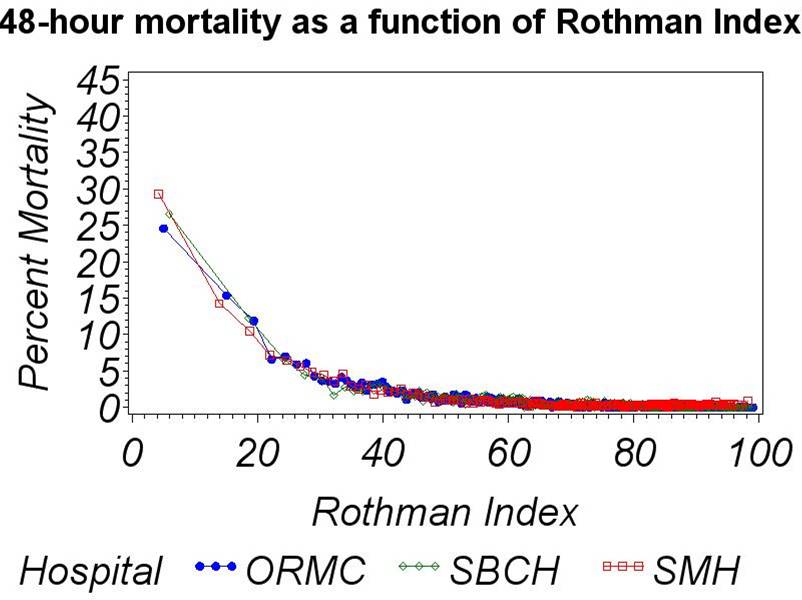
The graph on the right shows a
comparison of Rothman Index value vs. the probability of expiration within 48 hours for Rothman Index values computed for historical patient data
from
Orlando Regional Medical Center (ORMC),
Santa Barbara Cottage Hospital (SBCH),
and Sarasota Memorial Hospital (SMH).
For each curve,
about half a million Rothman Index values were computed for over 10,000 patients over a period of a year.
This data was collected into 100 "buckets" with different Rothman Index values,
and then each bucket was examined to see how many patients had died
within 48 hours after the time of the Rothman Index.
A strong correlation can be seen between
the Rothman Index and 48-hour mortality.
We have done extensive statistical analyses of data from several hospitals to show that the Rothman Index does correlate with other measures of a patient's condition.
The graph on the right shows a
comparison of Rothman Index value vs. the probability of expiration within 48 hours for Rothman Index values computed for historical patient data
from
Orlando Regional Medical Center (ORMC),
Santa Barbara Cottage Hospital (SBCH),
and Sarasota Memorial Hospital (SMH).
For each curve,
about half a million Rothman Index values were computed for over 10,000 patients over a period of a year.
This data was collected into 100 "buckets" with different Rothman Index values,
and then each bucket was examined to see how many patients had died
within 48 hours after the time of the Rothman Index.
A strong correlation can be seen between
the Rothman Index and 48-hour mortality.
Similar strong correlations were found between the Rothman Index value
and other measures of a patient's condition,
such as the APACHE score assigned when a patient enters the ICU,
the likelihood that a patient returns to the hospital within 6 months after discharge, and the likelihood that a patient dies within a year after discharge.
Please note that the Rothman Index is not intended to predict these events, but rather to track the ups and downs of a patient's condition. The purpose of these historical studies was to show that the Rothman Index is good at doing this.
Clinical Trial Results - Improved Patient Outcomes
We are also preparing to publish results of a 5-month clinical trial involving 1600 patients at Sarasota Memorial Hospital which showed that use of Rothman Index graphs leads to improved patient outcomes in terms of a statistically significant increase in patients sent home rather than to a skilled nursing or rehab facility.
In addition to improved patient health, this result represents savings of thousands of dollars per patient to our health care system.
We are submitting more details in a paper for publication in the medical literature.
|
)