Rothman Healthcare Research, LLC
Saving Lives
Our objective is to improve the continuity and quality of care in our healthcare system. The Rothman Index is the foundation of our platform for patient assessment. The Patient Condition Tracker is built on this platform, and transforms an Electronic Medical Record system from a mere data repository into a tool for saving lives.
The Rothman Index
Discerning a slow decline in a patient's condition is difficult with even a careful review of the medical record, especially if the physician or nurse has not seen the patient before. It is not that there is not enough data, but rather, too much and too hard to decipher. To a large extent, electronic medical records (EMR) are used simply as electronic filing cabinets. Little benefit in terms of either reducing cost or increasing quality has been observed so far. Our work leverages this digital resource. We extract, integrate, summarize and visualize.
) We have created a new single-number index based on a patient's vital signs, lab results, and nursing assessments. This index, named the Rothman Index in honor of the late Florence A. Rothman, is a measure of a patient's condition, and is particularly useful for showing changes in that condition. It is set on a scale of 0 to 100, with 100 being unimpaired,
and is meant to capture the immediate circumstance.
When plotted vs. time, the Rothman Index provides a picture that helps physicians and nurses determine if their patient is getting better or getting worse. Also, by reducing the patient's general condition to a single number, we facilitate communications between healthcare providers and between institutions.
The Rothman Index is computed from 26 vital signs, nursing assessments, and lab results commonly found in EMR systems, and so no extra work is required from doctors or nurses.
We have created a new single-number index based on a patient's vital signs, lab results, and nursing assessments. This index, named the Rothman Index in honor of the late Florence A. Rothman, is a measure of a patient's condition, and is particularly useful for showing changes in that condition. It is set on a scale of 0 to 100, with 100 being unimpaired,
and is meant to capture the immediate circumstance.
When plotted vs. time, the Rothman Index provides a picture that helps physicians and nurses determine if their patient is getting better or getting worse. Also, by reducing the patient's general condition to a single number, we facilitate communications between healthcare providers and between institutions.
The Rothman Index is computed from 26 vital signs, nursing assessments, and lab results commonly found in EMR systems, and so no extra work is required from doctors or nurses.
Comparison with Historical Data
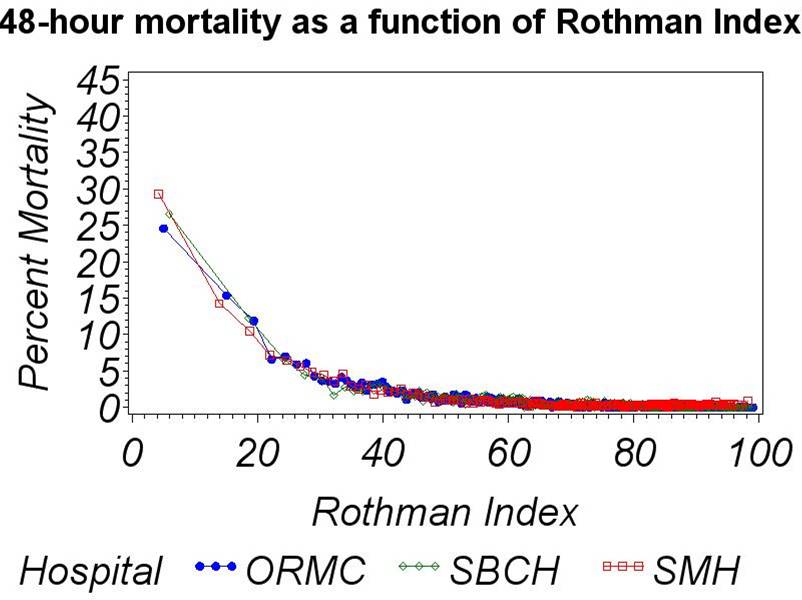 We have done extensive statistical analyses of data from several hospitals to show that the Rothman Index does correlate with other measures of a patient's condition.
The graph on the right shows a
comparison of Rothman Index value vs. the probability of expiration within 48 hours for Rothman Index values computed for historical patient data
from
Orlando Regional Medical Center (ORMC),
Santa Barbara Cottage Hospital (SBCH),
and Sarasota Memorial Hospital (SMH).
For each curve,
about half a million Rothman Index values were computed for over 10,000 patients over a period of a year.
This data was collected into 100 "buckets" with different Rothman Index values,
and then each bucket was examined to see how many patients had died
within 48 hours after the time of the Rothman Index.
A strong correlation can be seen between
the Rothman Index and 48-hour mortality.
We have done extensive statistical analyses of data from several hospitals to show that the Rothman Index does correlate with other measures of a patient's condition.
The graph on the right shows a
comparison of Rothman Index value vs. the probability of expiration within 48 hours for Rothman Index values computed for historical patient data
from
Orlando Regional Medical Center (ORMC),
Santa Barbara Cottage Hospital (SBCH),
and Sarasota Memorial Hospital (SMH).
For each curve,
about half a million Rothman Index values were computed for over 10,000 patients over a period of a year.
This data was collected into 100 "buckets" with different Rothman Index values,
and then each bucket was examined to see how many patients had died
within 48 hours after the time of the Rothman Index.
A strong correlation can be seen between
the Rothman Index and 48-hour mortality.
Similar strong correlations were found between the Rothman Index value and other measures of a patient's condition, such as the APACHE score assigned when a patient enters the ICU, the likelihood that a patient returns to the hospital within 6 months after discharge, and the likelihood that a patient dies within a year after discharge. Please note that the Rothman Index is not intended to predict these events, but rather to track the ups and downs of a patient's condition. The purpose of these historical studies was to show that the Rothman Index is good at doing this.
Clinical Trial Results - Improved Patient Outcomes
We are also preparing to publish results of a 5-month clinical trial involving 1600 patients at Sarasota Memorial Hospital which showed that use of Rothman Index graphs leads to improved patient outcomes in terms of a statistically significant increase in patients sent home rather than to a skilled nursing or rehab facility.
In addition to improved patient health, this result represents savings of thousands of dollars per patient to our health care system.
We are submitting more details in a paper for publication in the medical literature.
Patient Condition Tracker
Integration with an EMR
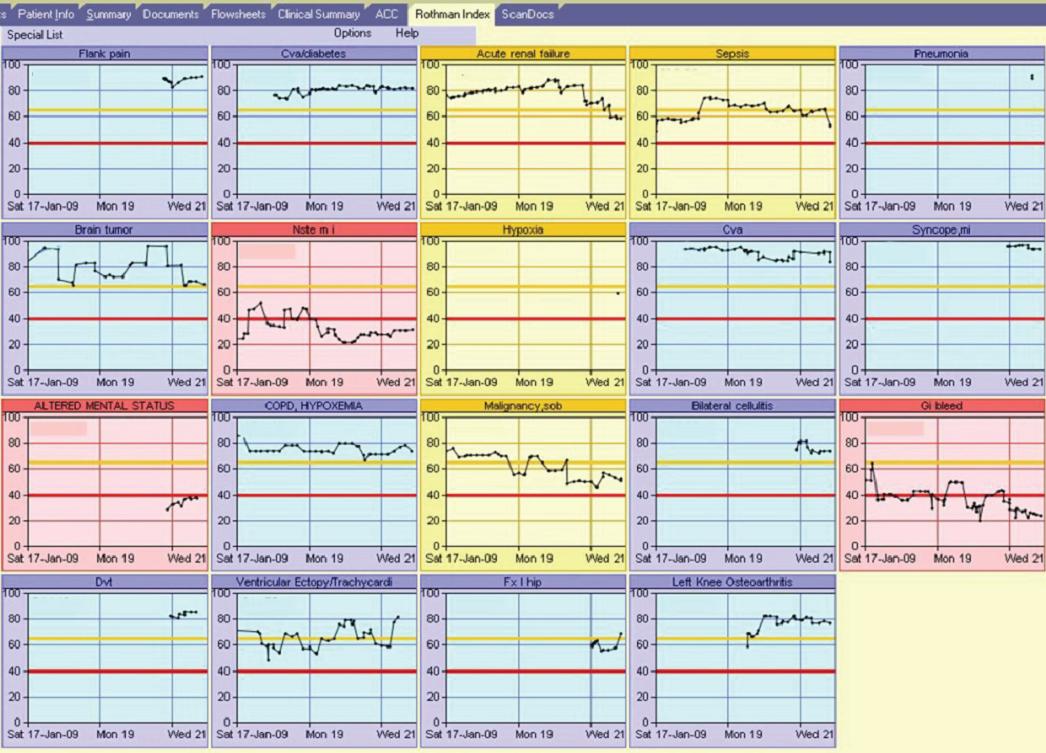
The picture above shows our Patient Condition Tracker integrated into Eclipsys Sunrise Clinical Manager (SCM) at Sarasota Memorial Hospital. Doctors and nurses can view their patients' Rothman Index graphs by clicking the new "Rothman Index" tab (top). The graphs are colored by the seriousness of the most recent Index; red if below 40, blue if above 65, and yellow in between. The slope of the curve indicates whether the patient's condition is improving or deteriorating. A doctor with a long list of patients can quickly spot those in most immediate need of attention.
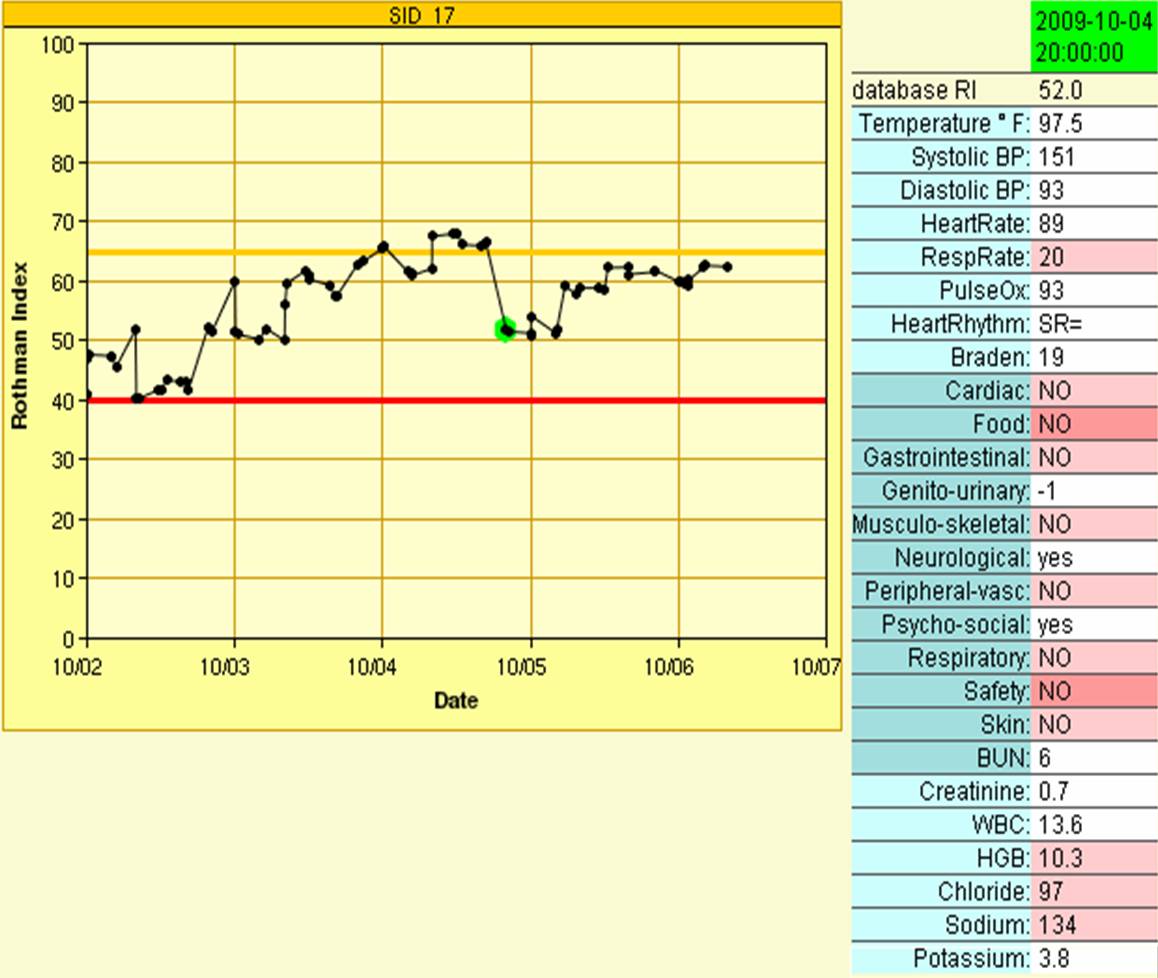
The nurses asked to be able to see why the Rothman Index value was what it was, and so we added a feature whereby clicking a point on a graph brings up a table of the components of that Rothman Index, as shown in the picture below. Clicking the graph also resets the SCM current patient, so that the full range of additional SCM information for that patient is already preselected.
)
)
Our web-enabled eTracker is a less tightly coupled but more widely available version of the Patient Condition Tracker. We envision doctors connecting to a secure website to monitor their patients. We have also used eTracker to allow researchers at several hospitals to view Rothman Index graphs for historical data.
You can
try eTracker for yourself
here
,
which shows our demo at the 2009 Eclipsys Users Network convention. Press the
"All Graphs"
button in the new window to see an array of 32 anonymized Rothman Index graphs. Click one of the thumbnails and then click a point on the graph to see why that Rothman Index value is what it is.
Stories From Life
Florence Rothman's StoryIt wasn't surprising that an 87-year old woman wasn't feeling great after heart surgery. But what couldn't be seen by the different members of the team caring for her was that, instead of slowly improving as she was supposed to, she was instead slowly but steadily declining day by day. No one-day decline was enough to cause alarm. She was, after all, 87 years old. Until it was too late.
After she died, her sons and friends joined together to create something to reduce the chances that this would happen to others. The Patient Condition Tracker is the result of that effort.
Ease of Use: The First Five Minutes
The first five minutes that the Patient Condition Tracker was ever used, something remarkable happened. Immediately after installation, even before hospital-wide release, the floor's unit manager came over and asked for permission to use the tool. Without further introduction to the Tracker, she immediately noted that the yellow and red-flagged patients were the very same ones which she and her nurses had spent most of their time caring for that day.
Next, she noticed a patient whose Tracker graph had recently fallen steeply. When she clicked on our graph, she noticed that the drop was largely due to the patient's pulse-oximetry reading, which had fallen to 85%. She immediately summoned the nurse to ask what had been going on.
When the nurse replied, "Oh, that patient's pulse-ox always runs low," the unit manager was able to use the Tracker to click on other points in time and show the nurse that over the preceding forty-eight hours the pulse-ox, which had started at 98%, had fallen past 92% to its current reading of 85%.
"Something is going wrong here," the two concurred, and proceeded to work together to discover the root of the problem and resolve it.
In the first five minutes the Tracker was ever used, it manifestly increased patient quality-of- care. The unit manager's initial experience with the product enabled her to identify, investigate, and begin to resolve a problem that, as the attending nurse's initial response indicates, may very well have gone undetected for some time.
Clearer Insights: An Unexpected Death
A Chief Medical Officer asked us to retroactively generate a graph for a patient who had died unexpectedly. The graph shows that the patient had been hovering between a score of 70-80 points on the Rothman Index for three days and then underwent a decline of fifty points in twelve hours prior to hovering around a score of 30 for three days before dying. If the attending physician had seen the fifty-point fall on the Rothman Index graph, he might have re-evaluated the patient's treatment.
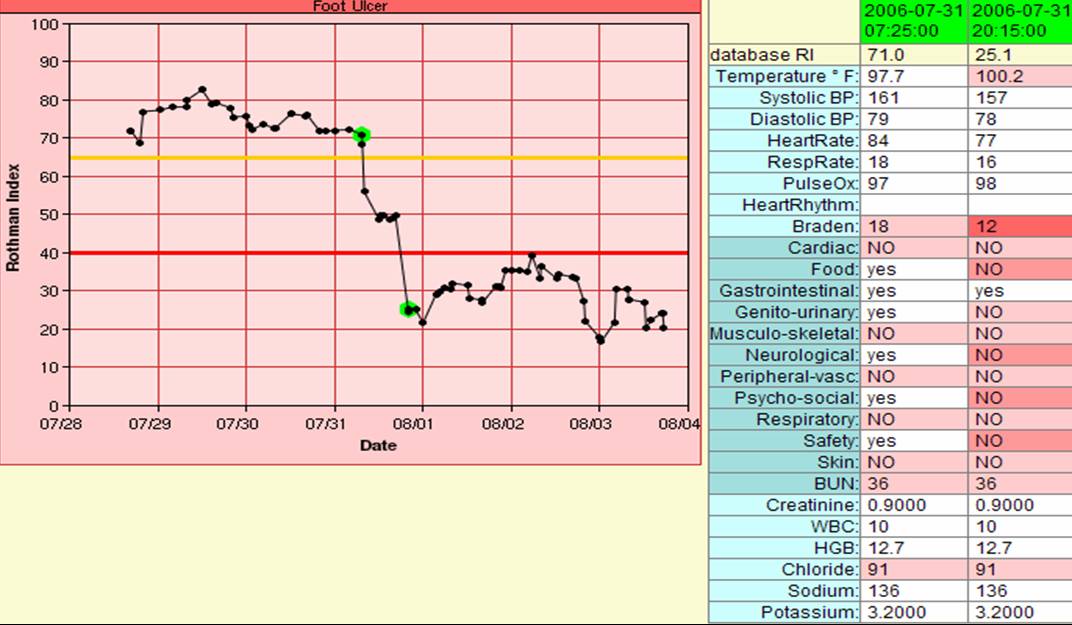
The nurses knew something was going wrong with this patient. Upon admission to the hospital, his condition did not appear critical, but three days into his stay at the hospital, the nurses' opinion of his condition changed drastically. He began failing nursing assessment after nursing assessment, eventually becoming violent.
Amazingly, throughout this drastic decline his vital signs stayed remarkably stable, as you can see from the chart at right. This account reinforces that vital signs are indeed vital. The human body's intrinsic objective is to remain balanced and stable. It will therefore shut down non-essential physiological systems in order to maintain vital signs within reasonable bounds.
Other companies have developed their own algorithms to assess patient condition, but they tend to rely on a subset of the available data, often focusing only on vital signs. The above example illustrates why our sophisticated Index, based on a comprehensive data set, significantly outperforms competing products in providing earlier meaningful patient insights.
Frequently Asked Questions
How is PCT different from APACHE?PCT is used throughout the hospital to improve patient care by letting doctors and nurses see downtrends that might go unnoticed, and so is an important part of improving quality of care, and improving patient outcomes. APACHE only applies to the ICU. It is explicitly NOT used for patient care. It IS used to compare the quality of one ICU to another on a statistical basis.
My hospital's Information Technology department is overwhelmed. How difficult is it to install the PCT at a hospital?
We estimate that the entire installation process takes two days of one person's time.
Will the PCT impact the response time of my hospital's EMR?
No. In controlled tests at Sarasota Memorial Hospital, the system IT people were unable to detect any impact of the PCT on performance or response time. When we pull data from the hospital's EMR database, we do it with a "no-lock" protocol. This means that no query ever waits for us.
Can the PCT be installed at a hospital with any EMR?
Yes. We are already installed at Eclipsys hospitals, and we have plans to integrate with all popular EMRs.
I see that you relate the Rothman Index to 48-mortality. How accurately do you predict death?
We do not predict death. The graph you saw was prepared to show that the RI correlates with another measure of patient condition. Whether someone lives or dies depends on more than their condition. It depends on the nature of the disease and the therapy being applied.
How does the PCT save money for a hospital?
If we avoid a crisis by detecting a downtrend earlier, then we avoid expensive treatments and extended stays.
We also know that the healthcare system will save money, because we have seen
our clinical trial reduce the number of people sent to skilled nursing facilities (SNFs) by about 10%. Each person who goes home instead of to a SNF saves the system an average of $8400. For a hospital with 20,000 patient visits, this translates to about $4 million of savings per year in avoided SNF/rehabilitation costs.
Who else does what you do?
No one. A company has attempted to monitor patient condition using vital signs alone and have in fact published a study showing that their system essentially does not provide any benefit beyond individual vital sign monitors.
My doctors are great and they DO know how their patients are. Why would they need this system?
All doctors would benefit from having a back-up,an assistant which provides context for an examination. Note we do NOT tell doctors what to do. We just say, "Be a doctor". This patient is declining, figure out why and help him.
What is your overall message?
EMRs alone do not automatically save either money or lives, but they are a foundation for applications such as ours, which leverage this digitalization of the medical record to improve the quality of care, lower costs, and save lives.
About Us
Who We Are
Duncan Dr. Duncan Finlay became CEO of Rothman Healthcare Research, LLC, in February of 2008 after acting as medical advisor and as a passionate supporter of the Rothman Index development project for four years. Dr. Finlay brings experience from both sides of the health care world to Rothman Healthcare Research. He spent 24 years as a practicing physician, is board certified in Internal Medicine, Pulmonary Disease and Sleep Medicine, and is a fellow of the College of Chest Physicians and the American Sleep Disorders Association.
After 3 years as Chief Medical Officer, he was President and CEO of Sarasota Memorial Hospital from 2000 to 2005, a period during which the organization received recognition and numerous awards, including nursing Magnet status and a listing as a top 50 hospital by US News and World Report.
Dr. Finlay received his BS and MD degrees from the University of Florida, where he was elected to AOA medical honorary society. He completed his postgraduate fellowships in Clinical Pharmacology and Pulmonary Disease at Emory University.
Dr. Duncan Finlay became CEO of Rothman Healthcare Research, LLC, in February of 2008 after acting as medical advisor and as a passionate supporter of the Rothman Index development project for four years. Dr. Finlay brings experience from both sides of the health care world to Rothman Healthcare Research. He spent 24 years as a practicing physician, is board certified in Internal Medicine, Pulmonary Disease and Sleep Medicine, and is a fellow of the College of Chest Physicians and the American Sleep Disorders Association.
After 3 years as Chief Medical Officer, he was President and CEO of Sarasota Memorial Hospital from 2000 to 2005, a period during which the organization received recognition and numerous awards, including nursing Magnet status and a listing as a top 50 hospital by US News and World Report.
Dr. Finlay received his BS and MD degrees from the University of Florida, where he was elected to AOA medical honorary society. He completed his postgraduate fellowships in Clinical Pharmacology and Pulmonary Disease at Emory University.
 Michael Rothman, President of RHR, brings extensive data analysis expertise to the Rothman Healthcare Research team. He is president and founder of Michael Rothman & Associates, was Senior Vice President of Strategic Information at First USA Bank, and also worked as an executive consultant and principal for IBM Consulting Group. He has received 2 patents for his work in customer data analysis. Michael received his bachelor.s and master.s degree in chemistry from Brown University, and a doctorate in Physical Chemistry from the University of Michigan.
Steven
Michael Rothman, President of RHR, brings extensive data analysis expertise to the Rothman Healthcare Research team. He is president and founder of Michael Rothman & Associates, was Senior Vice President of Strategic Information at First USA Bank, and also worked as an executive consultant and principal for IBM Consulting Group. He has received 2 patents for his work in customer data analysis. Michael received his bachelor.s and master.s degree in chemistry from Brown University, and a doctorate in Physical Chemistry from the University of Michigan.
Steven Steven I. Rothman, Systems Analyst for RHR, contributes experience in systems engineering and computer software/hardware designing to the team. He is also the current Chairman of Zavanna USA, and worked for the MITRE Corporation. Steven received his B.S. in Electrical Engineering from the Rensselaer Polytechnic Institute in 1969, and his M.S.E.M. from Northeastern University in 1972.
George
 George Almasi, Chief Technical Officer and Software Architect for RHR, brings an in-depth knowledge of systems programming, data analysis, and computer processing with his background as the Vice President for Technology at Michael Rothman and Associates, and as the former Senior Manager, professor, and research staff member on the Blue Gene Project and Parallel Applications & Algorithms Group for IBM. He is also the author of 40 published papers and 4 books, the holder of 21 patents, and a Fellow of the IEEE. He received his B.S. in Electrical Engineering from Syracuse University and Ph.D. in Electrical Engineering from Massachusetts Institute of Technology.
Daniel
George Almasi, Chief Technical Officer and Software Architect for RHR, brings an in-depth knowledge of systems programming, data analysis, and computer processing with his background as the Vice President for Technology at Michael Rothman and Associates, and as the former Senior Manager, professor, and research staff member on the Blue Gene Project and Parallel Applications & Algorithms Group for IBM. He is also the author of 40 published papers and 4 books, the holder of 21 patents, and a Fellow of the IEEE. He received his B.S. in Electrical Engineering from Syracuse University and Ph.D. in Electrical Engineering from Massachusetts Institute of Technology.
Daniel Daniel Rothman, Business Developer for RHR, brings a combination of entrepreneurial, academic, and research based expertise to the Rothman team. He was founder and director of Axon Potential, manager of NightPilot, and lab manager for Brown University's Virtual Environment Navigation Lab. Daniel received his B.S. in Cognitive Neuroscience from Brown University, and is currently pursuing his MBA with a focus on Healthcare from University of California at Irvine.
Contact Us:
Rothman Healthcare Research, LLC.
3905 State Street, Suite 7-231
Santa Barbara, CA 93110
Office:
805 576 7654
Fax:
805 576 7727
Email:
contact@rothmanindex.com