|
Patient
Condition Tracker
The Rothman Index in action...
|
Integration with an EMR
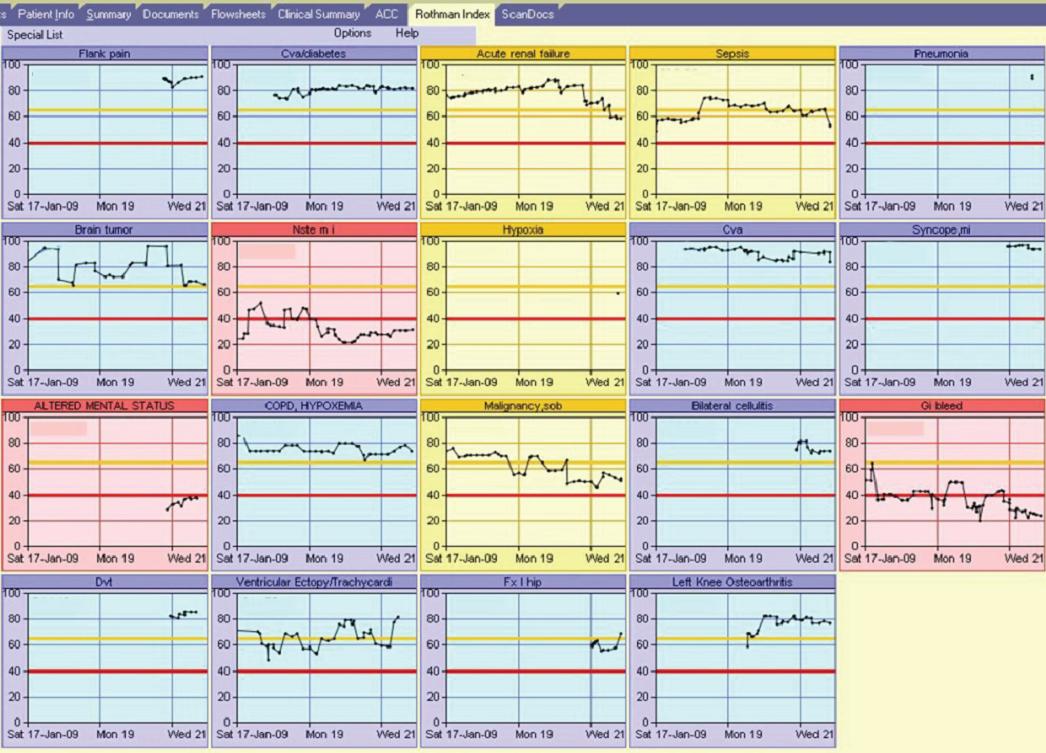
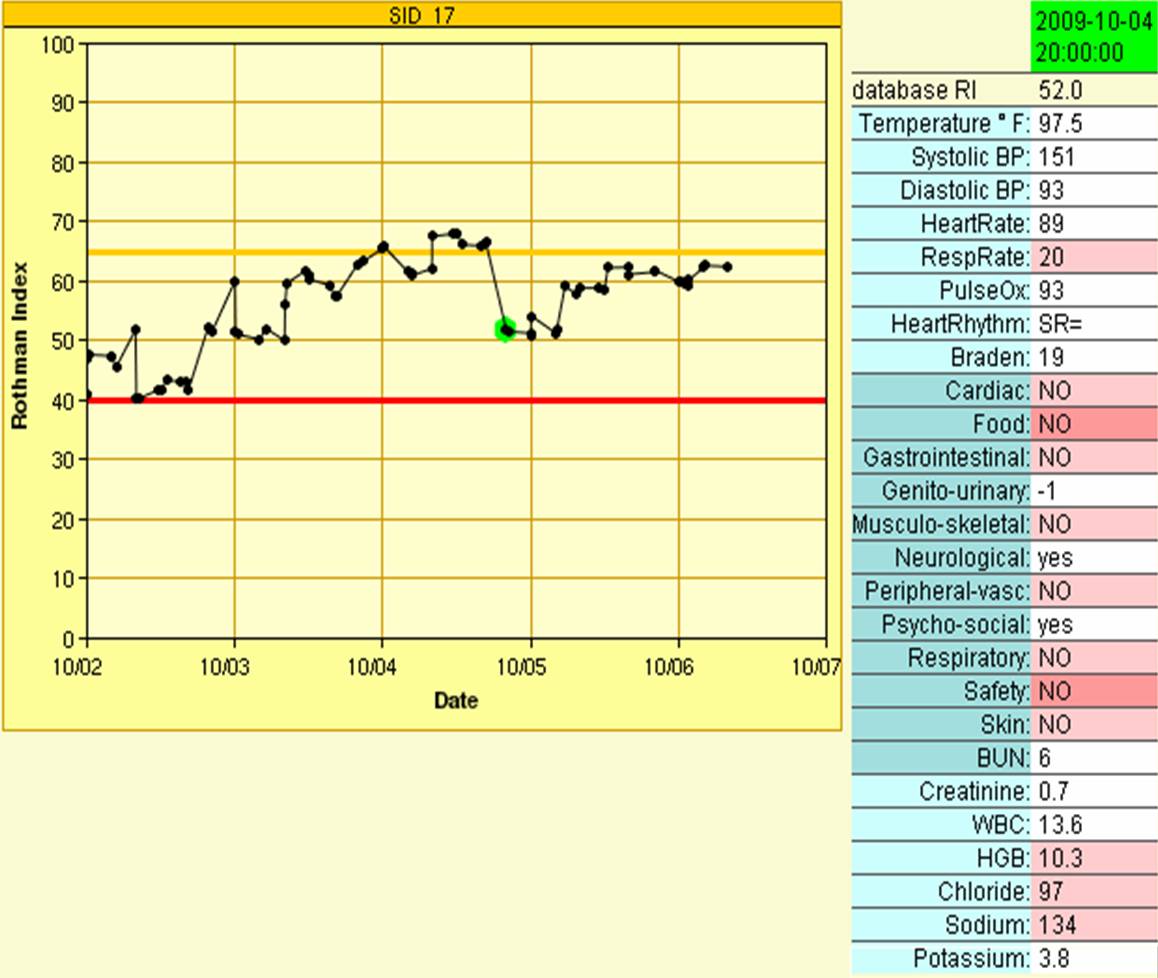
The picture above shows our Patient Condition Tracker integrated into Eclipsys Sunrise Clinical Manager (SCM) at Sarasota Memorial Hospital. Doctors and nurses can view their patients' Rothman Index graphs by clicking the new "Rothman Index" tab (top). The graphs are colored by the seriousness of the most recent Index; red if below 40, blue if above 65, and yellow in between. The slope of the curve indicates whether the patient's condition is improving or deteriorating. A doctor with a long list of patients can quickly spot those in most immediate need of attention. The nurses asked to be able to see why the Rothman Index value was what it was, and so we added a feature whereby clicking a point on a graph brings up a table of the components of that Rothman Index, as shown in the picture below. Clicking the graph also resets the SCM current patient, so that the full range of additional SCM information for that patient is already preselected.
Our web-enabled eTracker is a less tightly coupled but more widely available version of the Patient Condition Tracker. We envision doctors connecting to a secure website to monitor their patients. We have also used eTracker to allow researchers at several hospitals to view Rothman Index graphs for historical data.
|
 As an integral part of the EMR system
)
)